April 2025 online casino revenue
New Jersey and Michigan, from the states' own reports. All months and the latest numbers.
The month in short
- New Jersey online casinos and poker rooms won $235.2 million from players in April 2025, up 25.2% from April 2024 and down 3.6% from the month before.
- Year to date, New Jersey is at $908.4 million, up 21.0% on the same months of 2024.
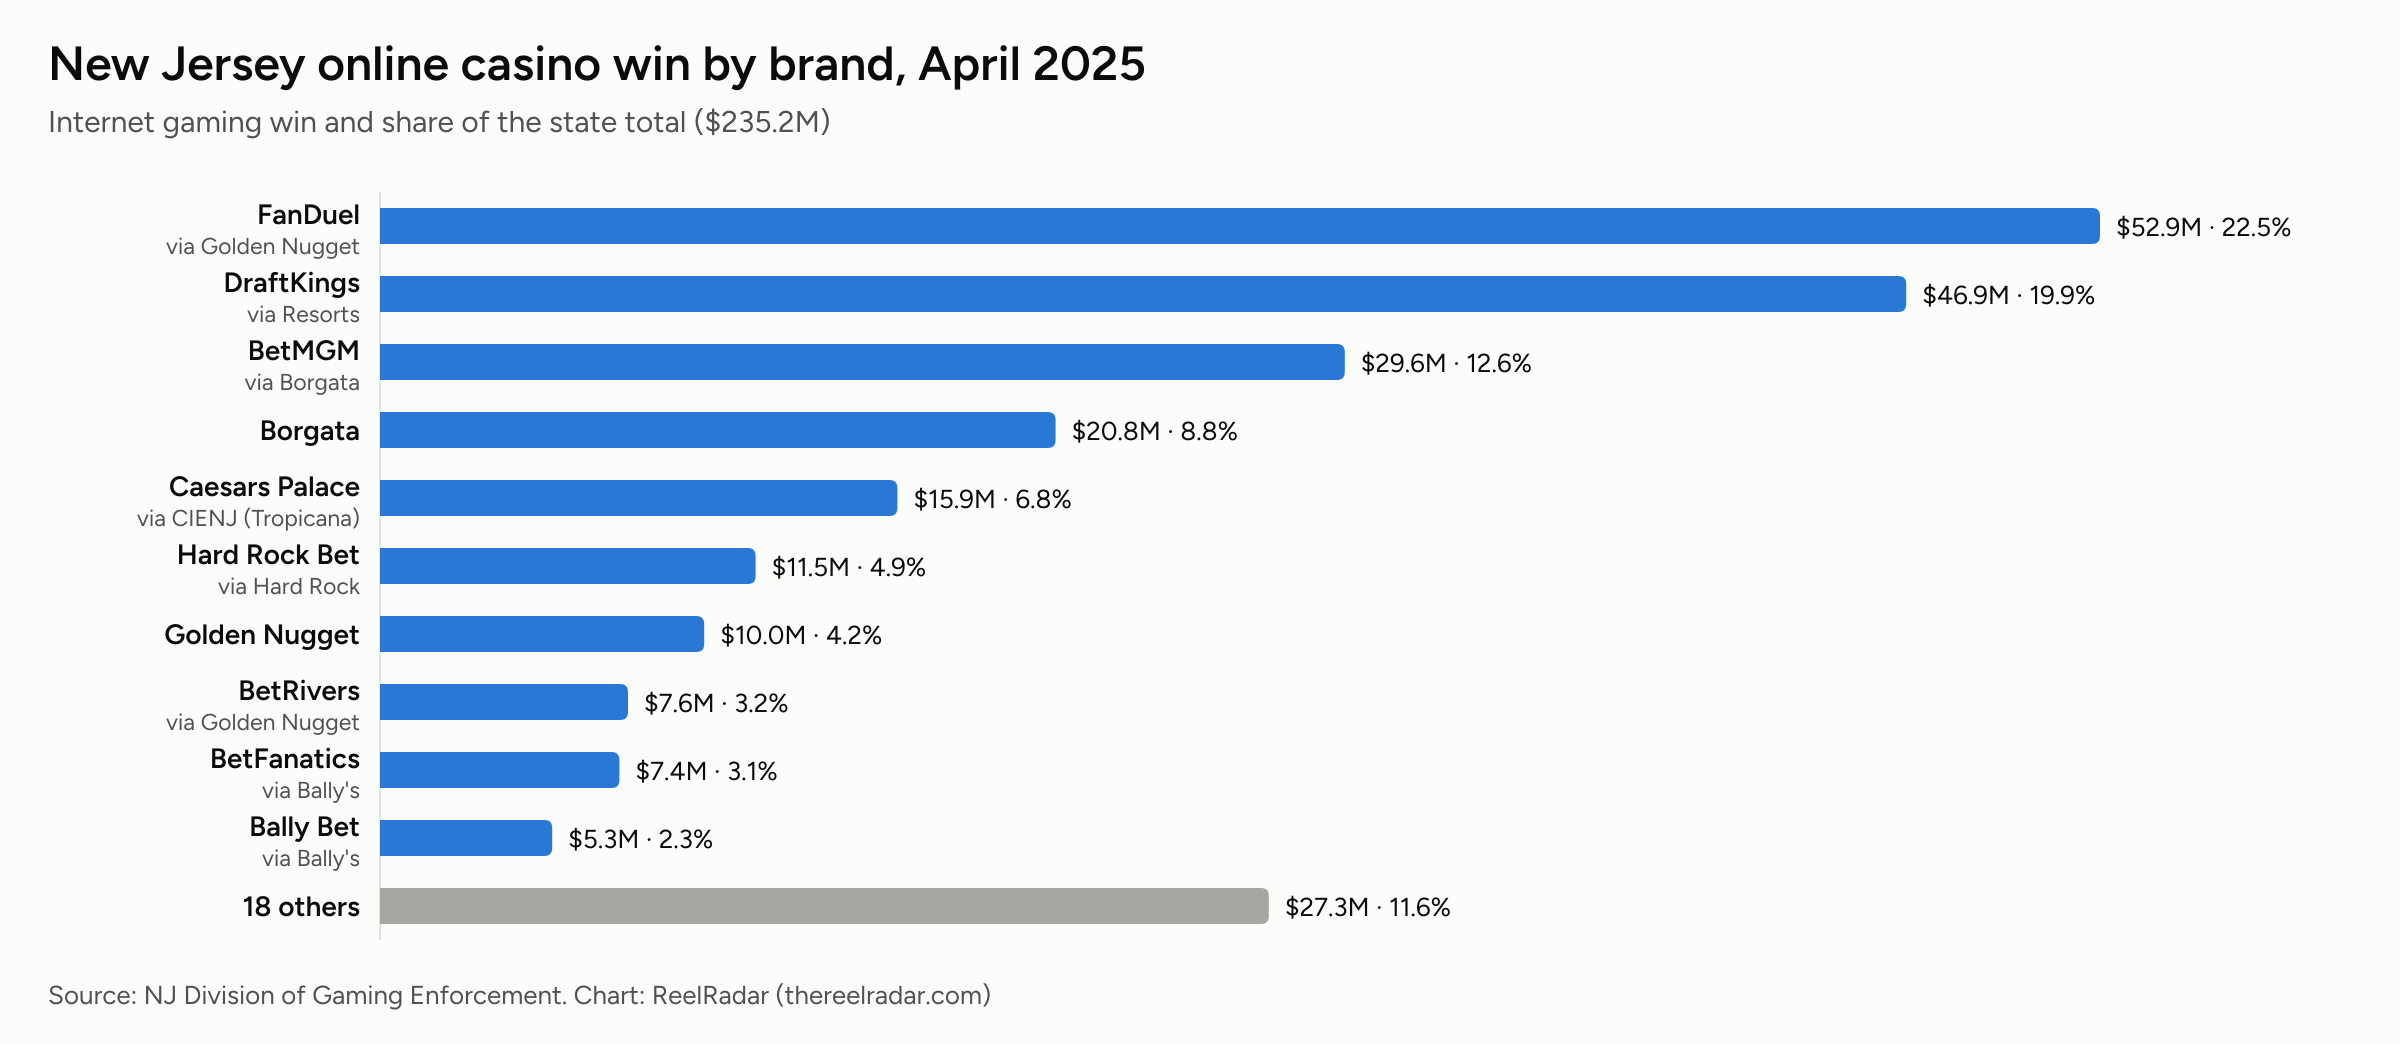
- The two biggest brands, FanDuel (22.5%) and DraftKings (19.9%), took 42.4% of the state's online win between them.
- Fastest growth among New Jersey brands with at least $5 million in the month: Golden Nugget, up 48.5% year over year.
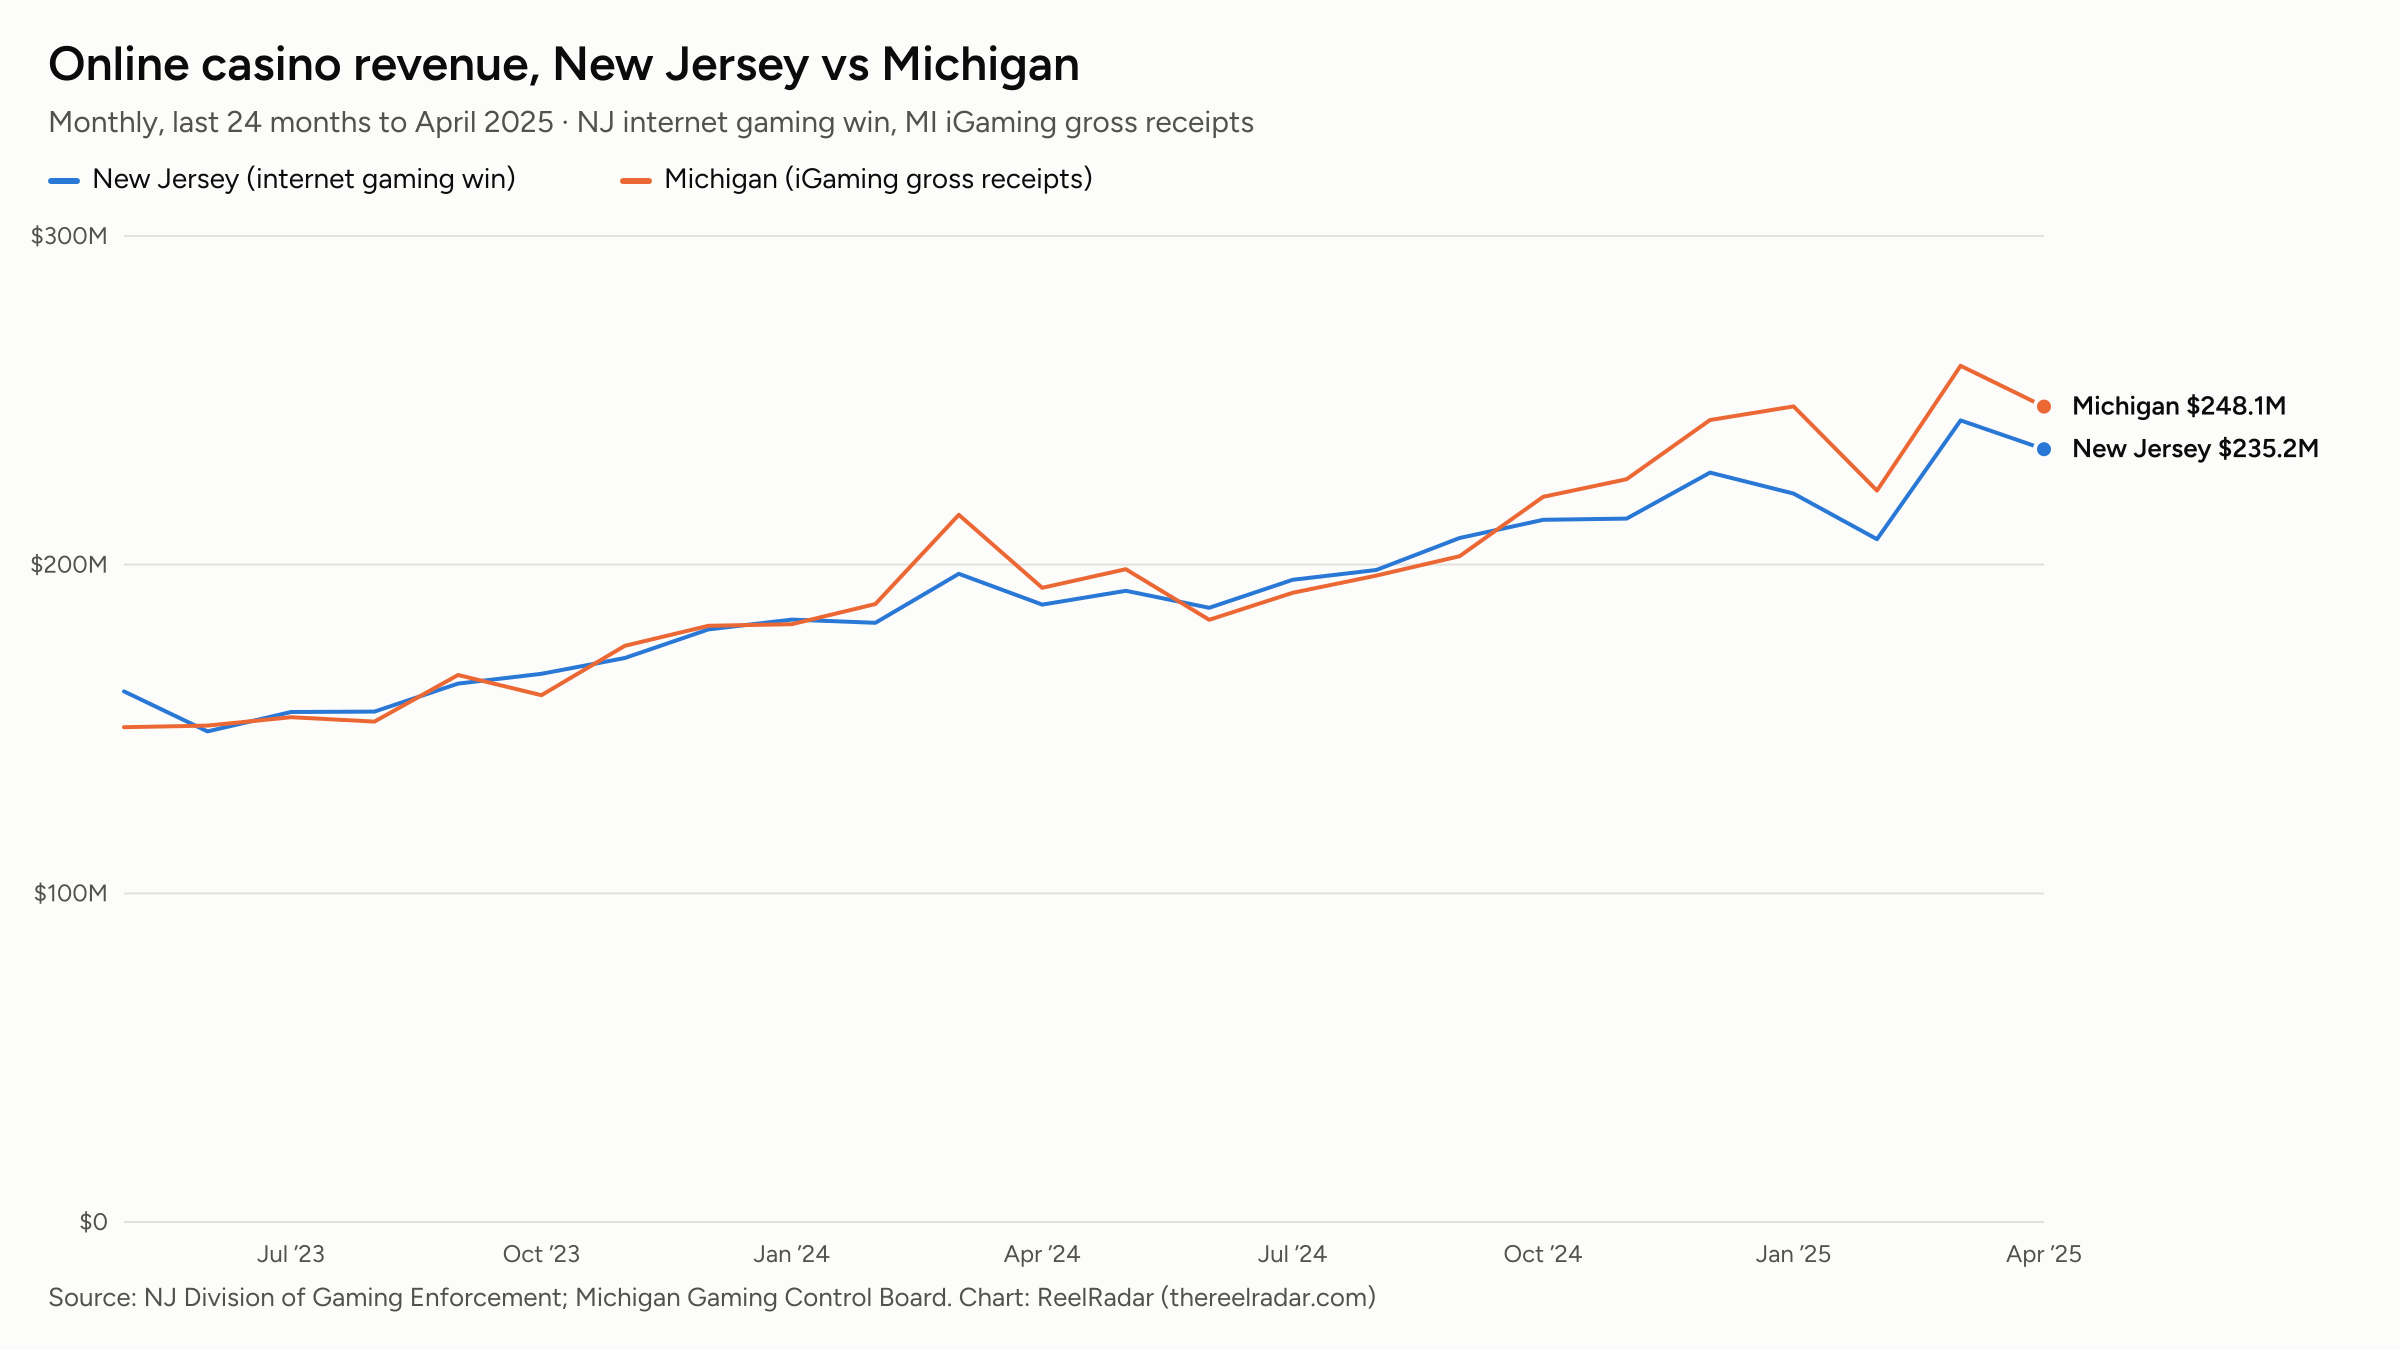
- Michigan's online casinos took in $248.1 million in iGaming gross receipts in April 2025, up 28.6% from April 2024. After the promotional deductions Michigan allows, adjusted gross receipts were $233.1 million.
- Together, the two states' online casinos won $483.3 million in April 2025, up 26.9% year over year.
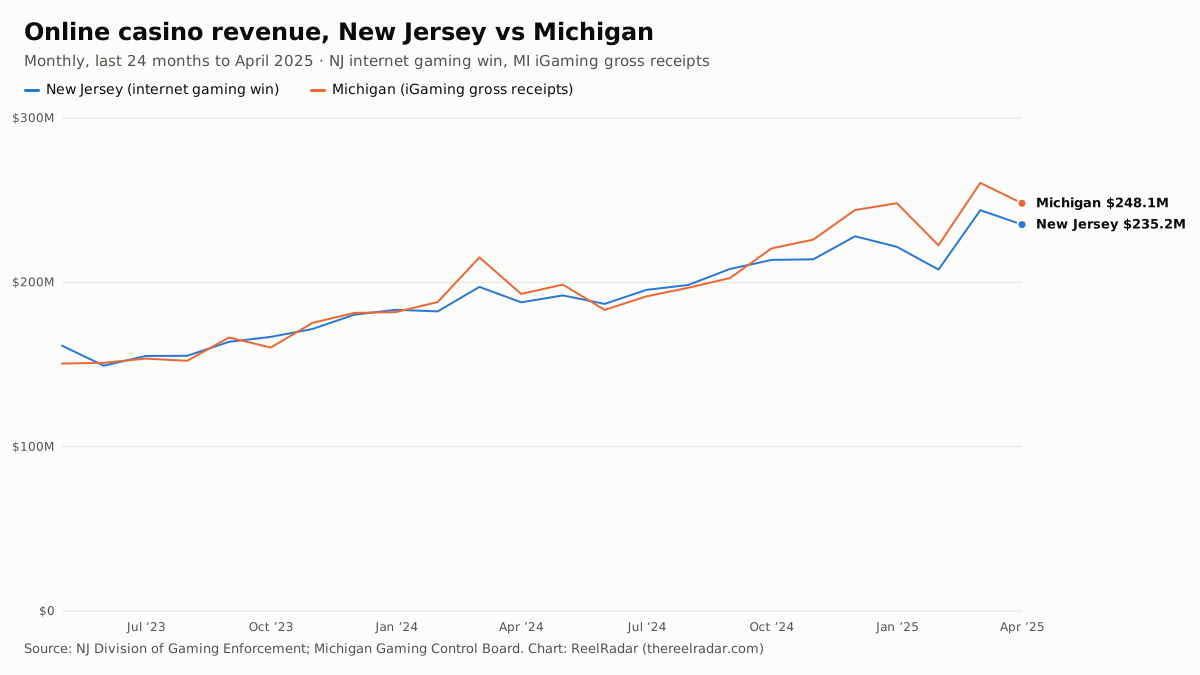
New Jersey vs Michigan, 24 months to April 2025
Monthly, in US dollars. New Jersey: internet gaming win. Michigan: iGaming gross receipts. Data: NJ DGE, Michigan Gaming Control Board. Analysis and chart: ReelRadar.
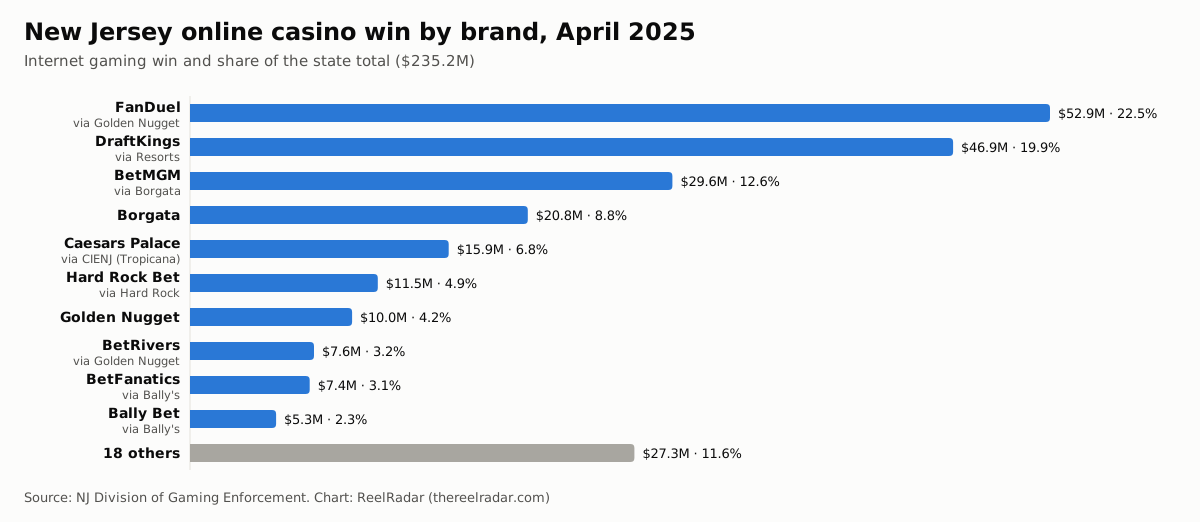
New Jersey by brand, April 2025
Top 10 brands by internet gaming win, with share of the $235.2M total.
| # | Brand (host casino) | April 2025 | Share | vs April 2024 |
|---|---|---|---|---|
| 1 | FanDuel via Golden Nugget | $52,853,086 | 22.5% | +35.3% |
| 2 | DraftKings via Resorts | $46,900,275 | 19.9% | +19.5% |
| 3 | BetMGM via Borgata | $29,646,598 | 12.6% | +27.9% |
| 4 | Borgata | $20,761,081 | 8.8% | +18.0% |
| 5 | Caesars Palace via CIENJ (Tropicana) | $15,901,304 | 6.8% | +40.1% |
| 6 | Hard Rock Bet via Hard Rock | $11,542,383 | 4.9% | +30.0% |
| 7 | Golden Nugget | $9,965,243 | 4.2% | +48.5% |
| 8 | BetRivers via Golden Nugget | $7,619,555 | 3.2% | +10.8% |
| 9 | BetFanatics via Bally's | $7,357,000 | 3.1% | — |
| 10 | Bally Bet via Bally's | $5,292,205 | 2.3% | −8.5% |
| 18 smaller brands: $27,314,153, 11.6% | ||||
| Total | $235,152,883 | 100% | +25.2% | |
All 28 brands
| # | Brand (host casino) | April 2025 | Share | vs April 2024 |
|---|---|---|---|---|
| 1 | FanDuel via Golden Nugget | $52,853,086 | 22.5% | +35.3% |
| 2 | DraftKings via Resorts | $46,900,275 | 19.9% | +19.5% |
| 3 | BetMGM via Borgata | $29,646,598 | 12.6% | +27.9% |
| 4 | Borgata | $20,761,081 | 8.8% | +18.0% |
| 5 | Caesars Palace via CIENJ (Tropicana) | $15,901,304 | 6.8% | +40.1% |
| 6 | Hard Rock Bet via Hard Rock | $11,542,383 | 4.9% | +30.0% |
| 7 | Golden Nugget | $9,965,243 | 4.2% | +48.5% |
| 8 | BetRivers via Golden Nugget | $7,619,555 | 3.2% | +10.8% |
| 9 | BetFanatics via Bally's | $7,357,000 | 3.1% | — |
| 10 | Bally Bet via Bally's | $5,292,205 | 2.3% | −8.5% |
| 11 | Playstar via Ocean Casino | $2,639,826 | 1.1% | +12.0% |
| 12 | ESPN Bet via Resorts | $2,567,920 | 1.1% | −22.8% |
| 13 | Tropicana Casino via CIENJ (Tropicana) | $2,483,157 | 1.1% | +7.1% |
| 14 | Bet365 via Hard Rock | $2,307,819 | 1.0% | +68.9% |
| 15 | Ocean via Ocean Casino | $1,927,667 | 0.8% | −11.2% |
| 16 | Resorts Casino via Resorts | $1,842,071 | 0.8% | −16.8% |
| 17 | Party Poker via Borgata | $1,695,935 | 0.7% | −9.2% |
| 18 | Jackpocket via CIENJ (Harrah's) | $1,402,913 | 0.6% | −11.5% |
| 19 | Monopoly via Bally's | $1,352,607 | 0.6% | −20.3% |
| 20 | Pala/Stardust via Borgata | $1,342,424 | 0.6% | +41.2% |
| 21 | PokerStars via Resorts | $1,254,709 | 0.5% | −18.8% |
| 22 | Parx via CIENJ (Harrah's) | $1,206,640 | 0.5% | +14.3% |
| 23 | Jackpot City via Golden Nugget | $1,191,366 | 0.5% | +4600.0% |
| 24 | Mohegan Sun via Resorts | $1,031,427 | 0.4% | −13.3% |
| 25 | WSOP via CIENJ (Tropicana) | $1,026,662 | 0.4% | +10.4% |
| 26 | Wheel of Fortune via Borgata | $756,817 | 0.3% | +37.4% |
| 27 | Spin Palace via Golden Nugget | $668,092 | 0.3% | +55.7% |
| 28 | Harrah's Casino via CIENJ (Tropicana) | $616,101 | 0.3% | −45.7% |
| Total | $235,152,883 | 100% | +25.2% |
Michigan, April 2025
| Measure | April 2025 | vs April 2024 |
|---|---|---|
| iGaming gross receipts | $248.1M | +28.6% |
| iGaming adjusted gross receipts | $233.1M | +33.9% |
| State iGaming taxes and payments | $48.2M | — |
| Paid to the City of Detroit (iGaming) | $12.6M | — |
Michigan by operator, April 2025
| # | Platform (licensee) | Gross receipts | Share | Adjusted | vs April 2024 |
|---|---|---|---|---|---|
| 1 | FanDuel MotorCity Casino | $67,558,695 | 27.2% | $63,505,174 | +33.2% |
| 2 | BetMGM MGM Grand Detroit | $64,943,918 | 26.2% | $61,047,283 | +30.4% |
| 3 | DraftKings Bay Mills Indian Community | $42,535,768 | 17.1% | $39,983,622 | +10.5% |
| 4 | Rush Street Little River Band of Ottawa Indians | $16,285,402 | 6.6% | $15,308,278 | +30.8% |
| 5 | William Hill Grand Traverse Band of Ottawa and Chippewa Indians | $16,061,505 | 6.5% | $15,097,815 | +42.3% |
| 6 | PointsBet Lac Vieux Desert Band of Lake Superior Chippewa Indians | $8,955,750 | 3.6% | $8,418,405 | +175.4% |
| 7 | Golden Nugget Online Gaming Keweenaw Bay Indian Community | $7,310,432 | 2.9% | $6,871,806 | +150.5% |
| 8 | Penn Sports Interactive / Barstool Sportsbook Greektown Casino | $6,645,485 | 2.7% | $6,246,756 | +44.3% |
| 9 | Parx Interactive Gun Lake Band of Pottawatomi Indians | $3,774,523 | 1.5% | $3,548,052 | +42.0% |
| 10 | Pala Interactive Pokagon Band of Potawatomi Indians | $3,697,244 | 1.5% | $3,475,409 | −11.5% |
| 11 | Wynn Sault Ste. Marie Tribe of Chippewa Indians | $3,147,189 | 1.3% | $2,987,063 | +35.1% |
| 12 | GAN Soaring Eagle Gaming | $2,757,751 | 1.1% | $2,481,976 | −31.5% |
| 13 | FoxBet Little Traverse Bay Bands of Odawa Indians | $2,253,842 | 0.9% | $2,118,611 | −24.7% |
| 14 | NYX Digital Nottawaseppi Huron Band of Pottawatomi Indians (FireKeepers Casino) | $1,544,535 | 0.6% | $1,451,863 | −23.5% |
| 15 | Hard Rock Hannahville Indian Community | $638,898 | 0.3% | $600,564 | −47.4% |
| Total | $248,110,938 | 100% | $233,142,676 | +28.6% |
Use these charts and numbers
Free to republish with credit and a link: Data: NJ DGE, Michigan Gaming Control Board. Analysis and chart: ReelRadar. Link to https://www.thereelradar.com/data/online-casino-revenue/2025-04/. Licence: CC BY 4.0.
Charts for April 2025: NJ vs MI, PNGSVGNJ by brand, PNGSVG · Data: nj-monthly.csvnj-operators.csvmi-monthly.csvmi-operators.csv
Need a different cut (a single operator, a longer range, a state comparison)? Write to hello@thereelradar.com.
Sources
- New Jersey: DGE monthly press release for April 2025 (released May 16, 2025).
- Michigan: MGCB release for April 2025 (released May 20, 2025). Statewide figures are as printed, rounded to $0.1 million.
What these numbers are
- New Jersey, internet gaming win: what players lost to the state's licensed online casinos and poker rooms in the month (bets minus winnings paid), before promotional deductions. Published by the NJ Division of Gaming Enforcement around the middle of the following month. Online poker is a small part of it (peer-to-peer, $2.6M in August 2026).
- Michigan, iGaming gross receipts: the same measure for Michigan's online casinos and poker, published by the Michigan Gaming Control Board, usually in the third week of the following month. Adjusted gross receipts subtract the free-play and promotional credits Michigan lets operators deduct; the state taxes that figure.
- We compare New Jersey's win with Michigan's gross receipts because both are measured before promotions. Online sports betting is not included in either.
- From 2025 New Jersey reports each brand (FanDuel, DraftKings, BetMGM…) with the casino that hosts it; for 2023–2024 it reported by casino licensee only.
21+. These are the states' figures for licensed operators; they say nothing about any one player's chances. Gambling problem? New Jersey: 1-800-GAMBLER. Michigan: 1-800-270-7117.